This page lists the release notes from every version of the data portal and catalog developed by Axiom Data Science in collaboration with its scientific partners.
February 27, 2025
This version implements updates to the version 2.14 and new user-requested features, including enhancements to improve the performance of real-time webcam services and gridded data, and additional features to improve the user map experience through color bar and coordinate system management.
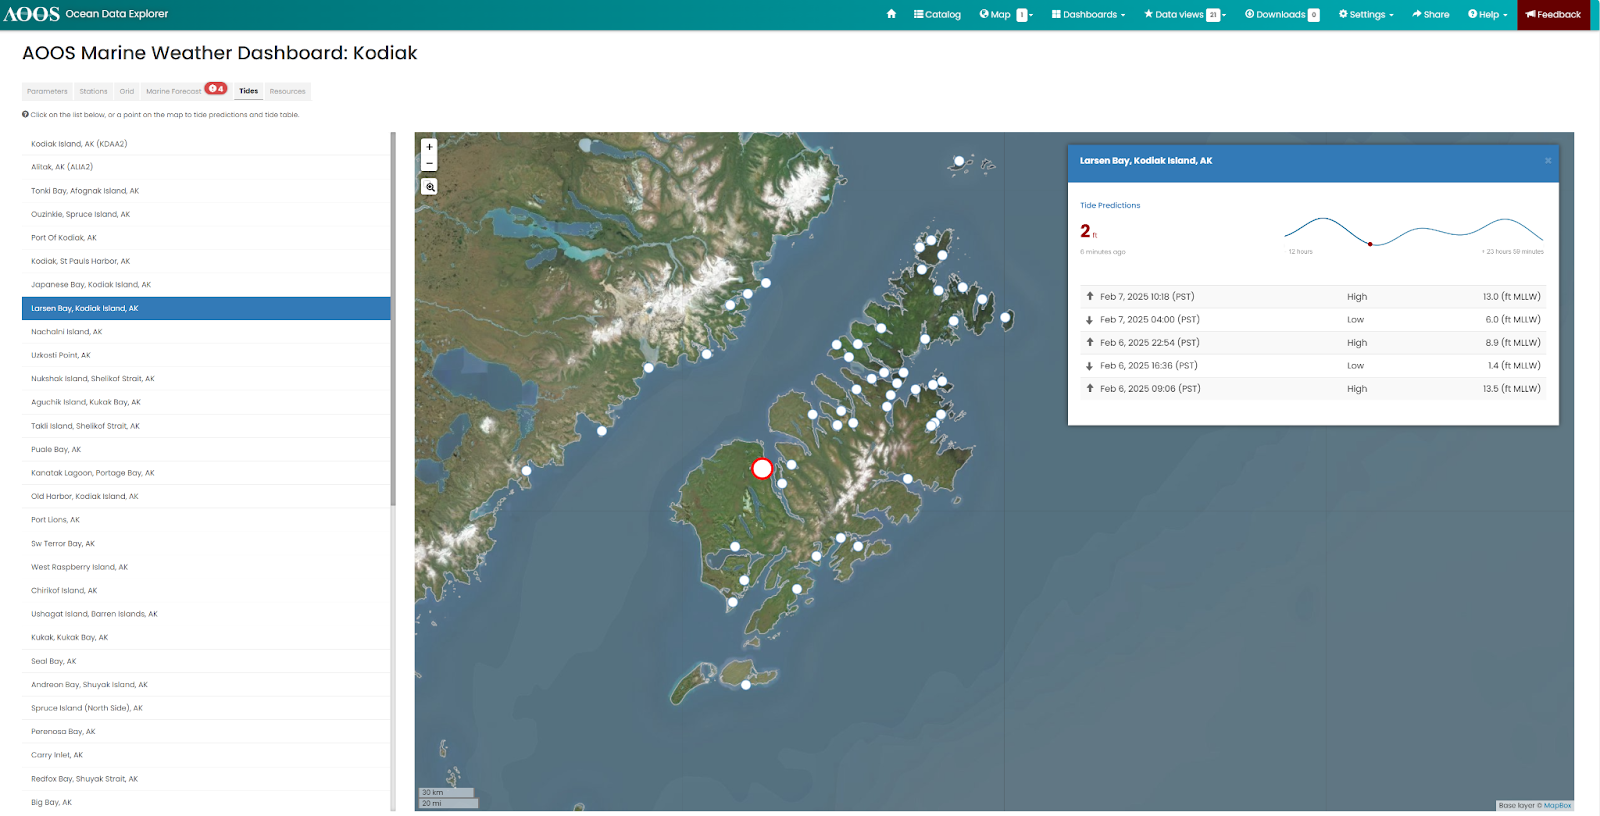
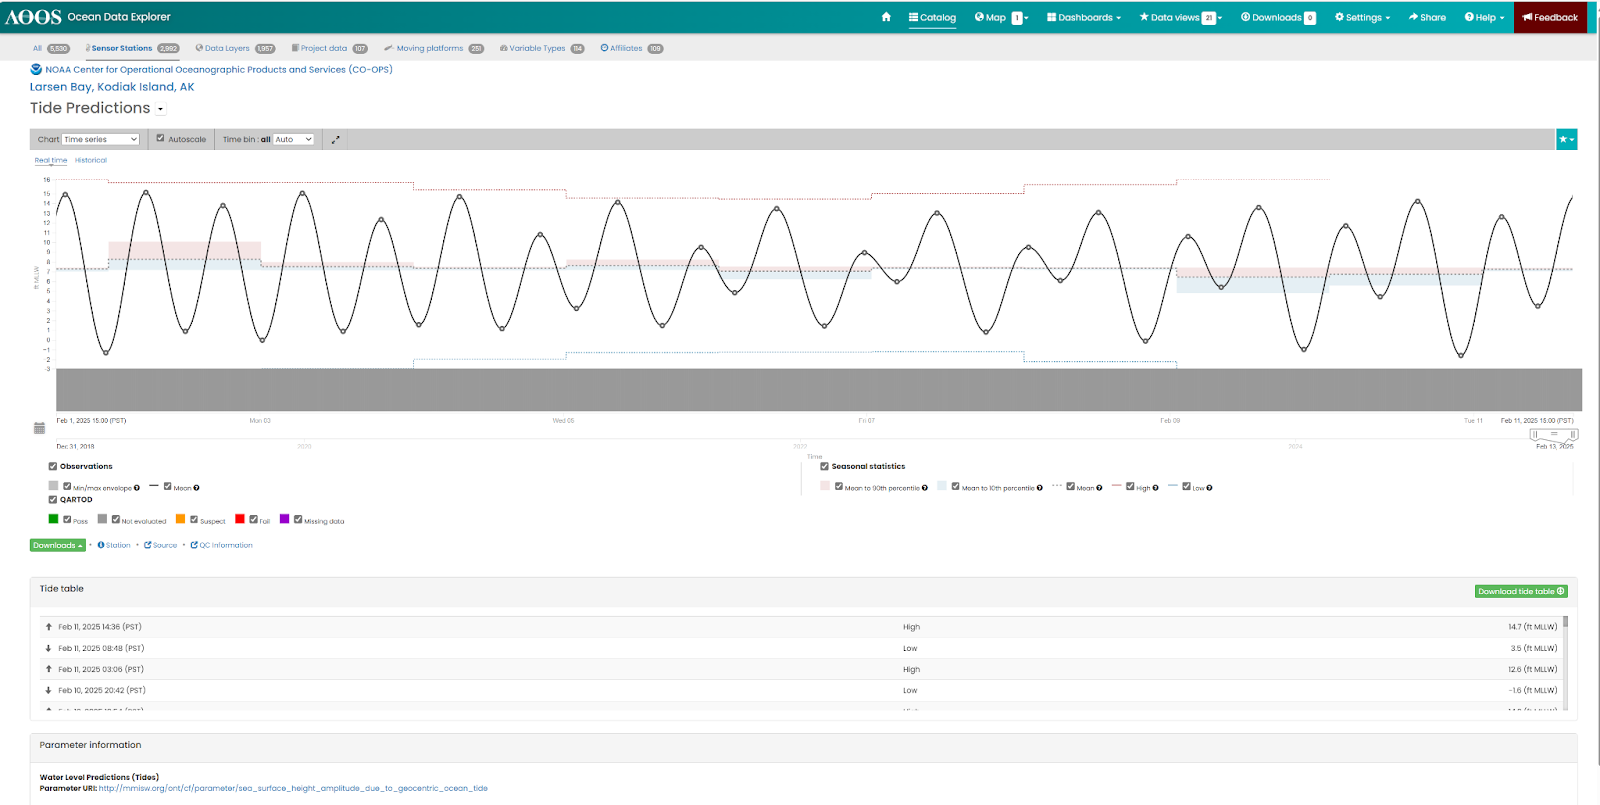
New high/low tables added to tide visualizations.
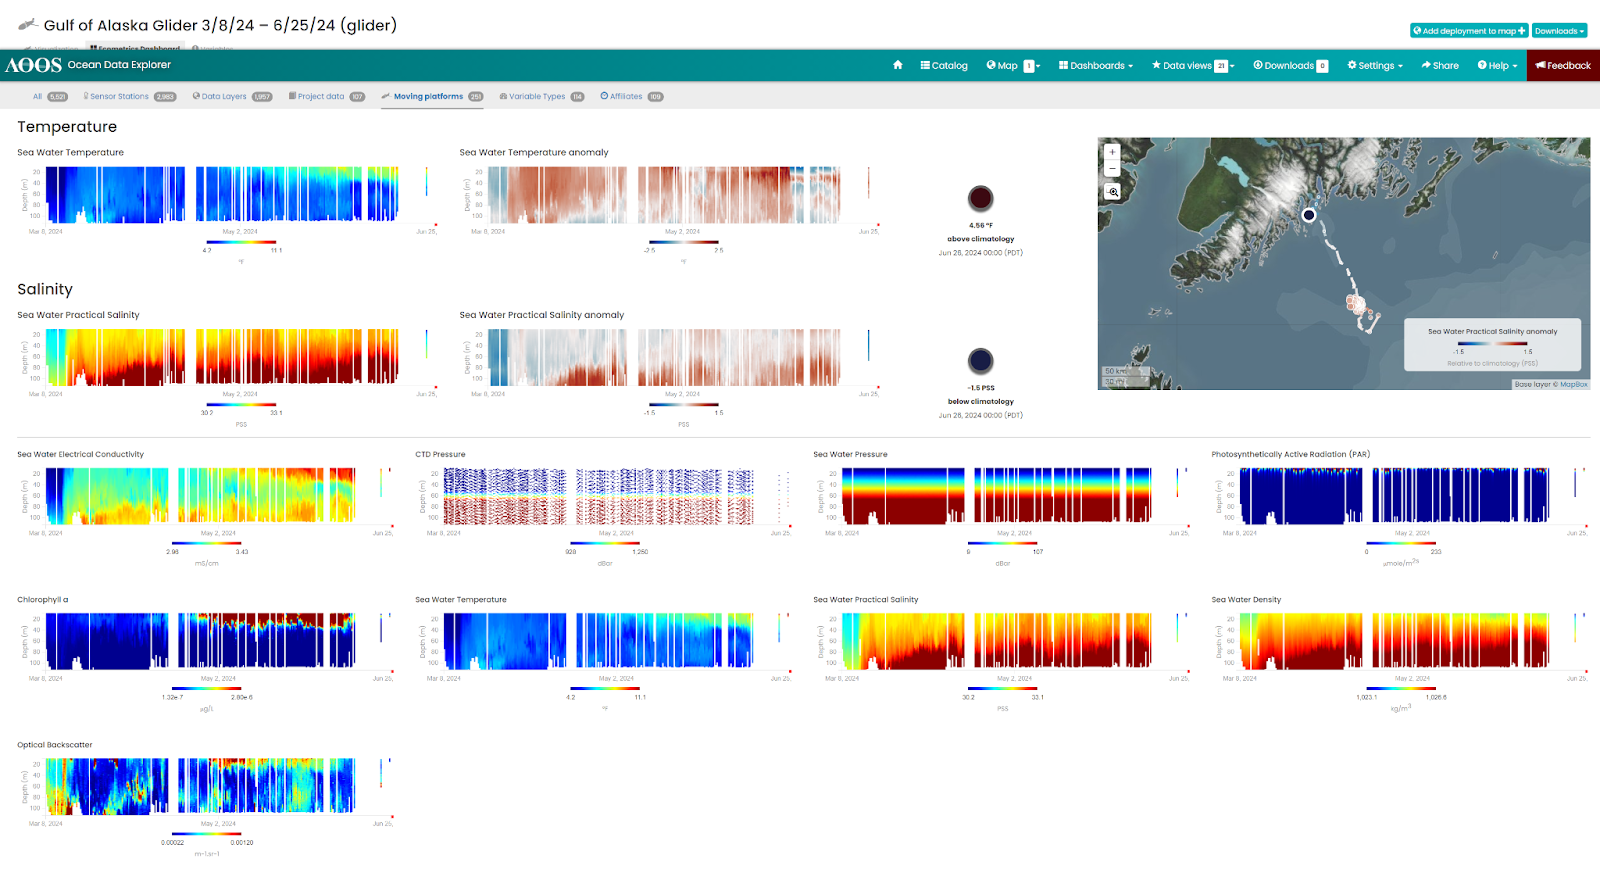 Glider Ecometrics Dashboards.
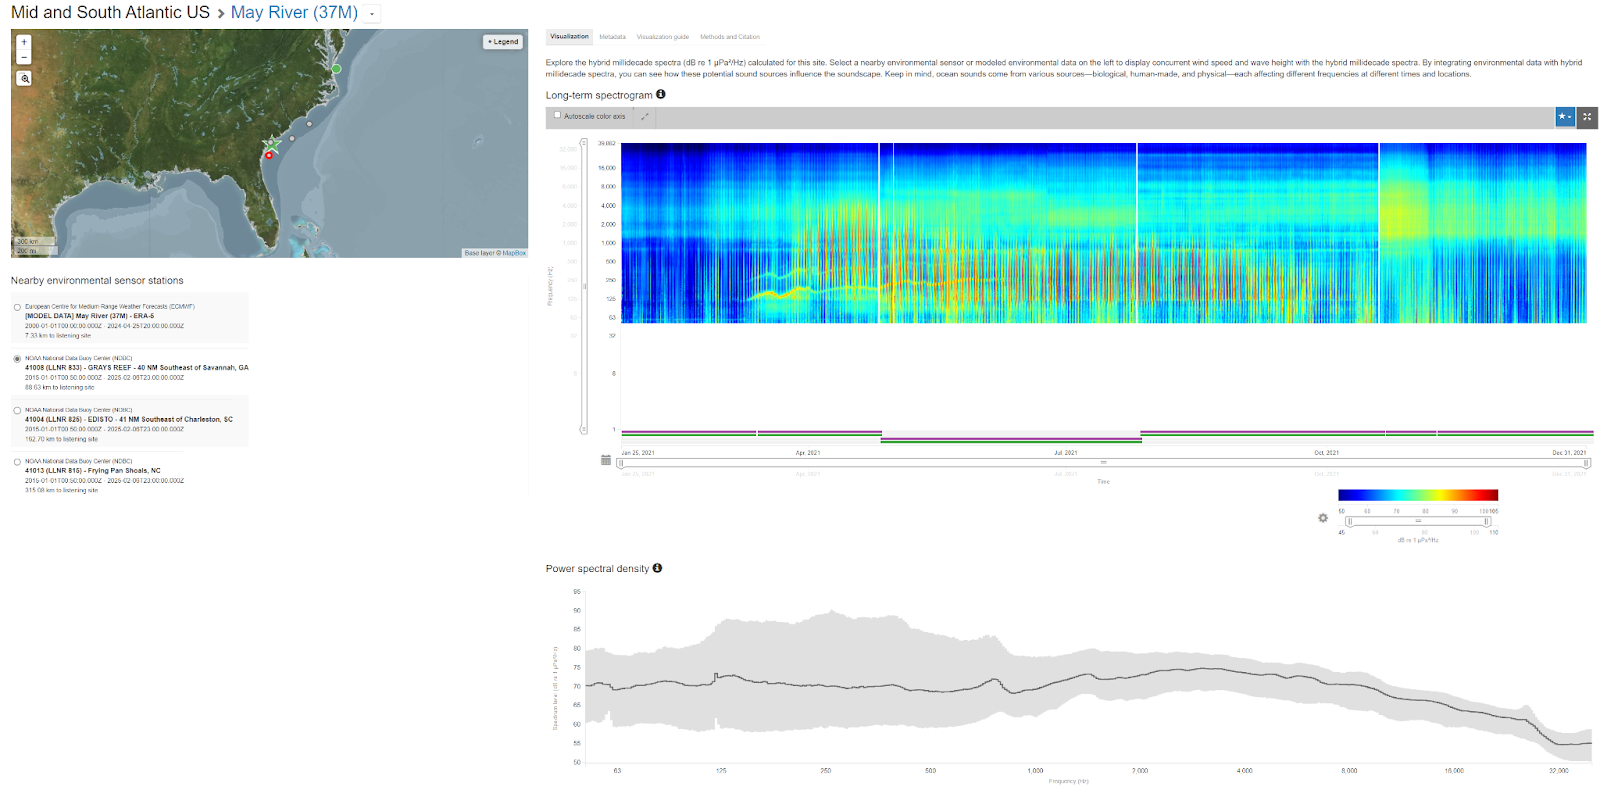 Long-term spectogram and power spectral density visualization.
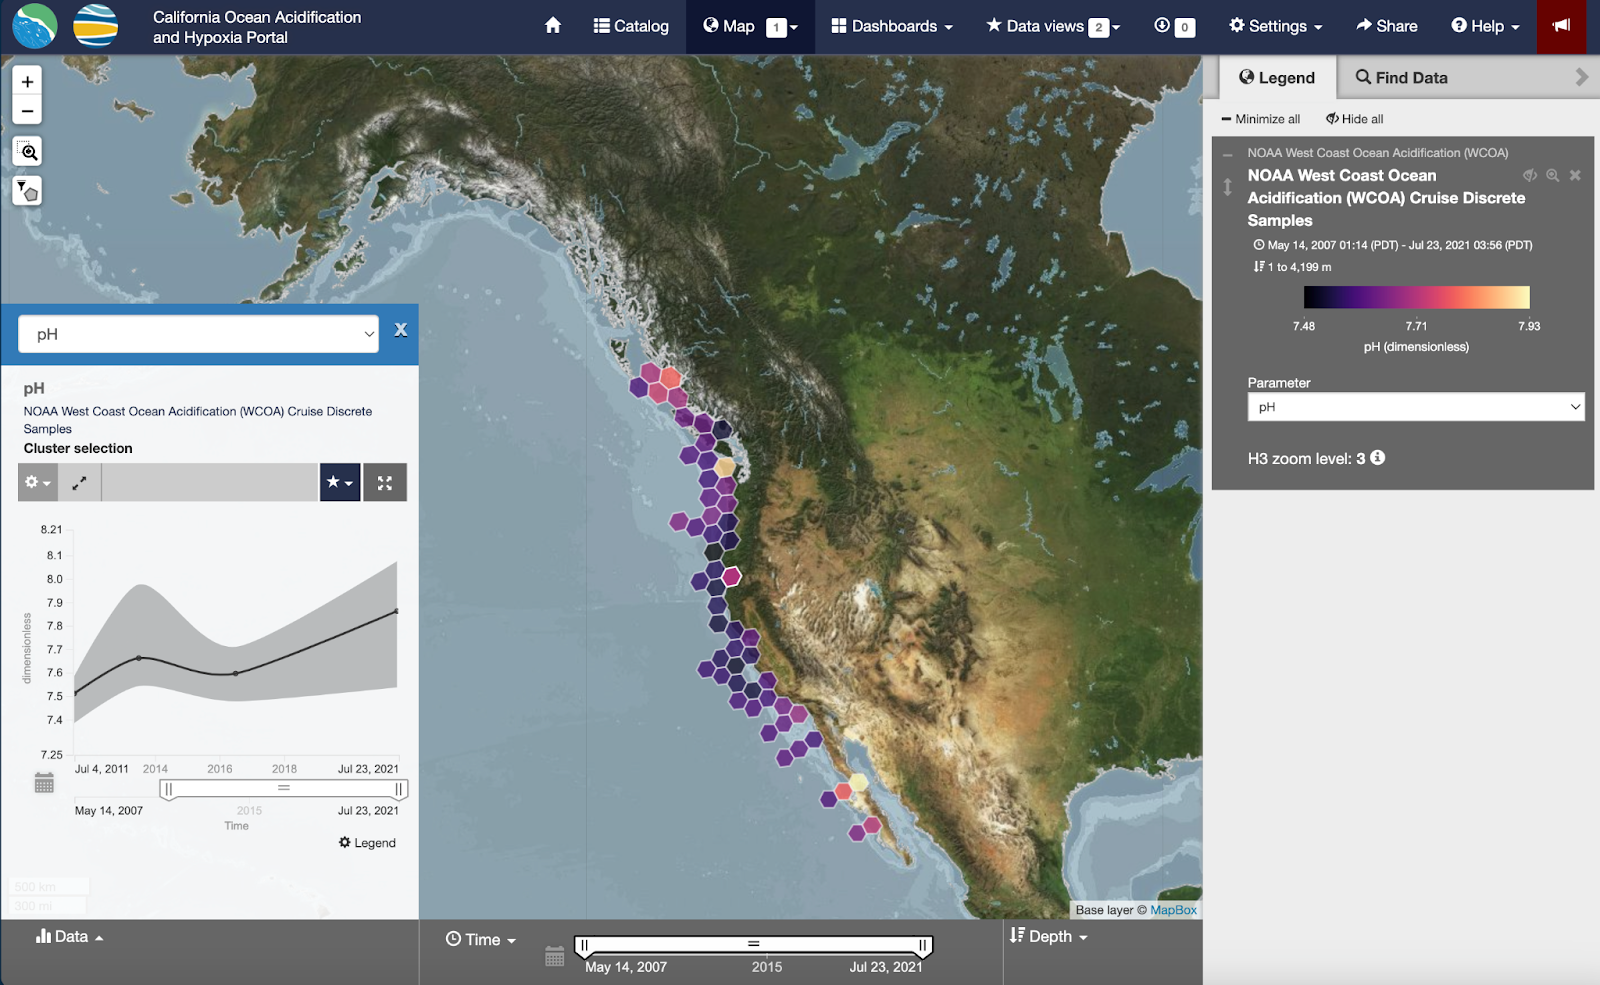 Timeseries of average pH collected from CTD casts across 4 distinct cruises between 2011 and 2021.
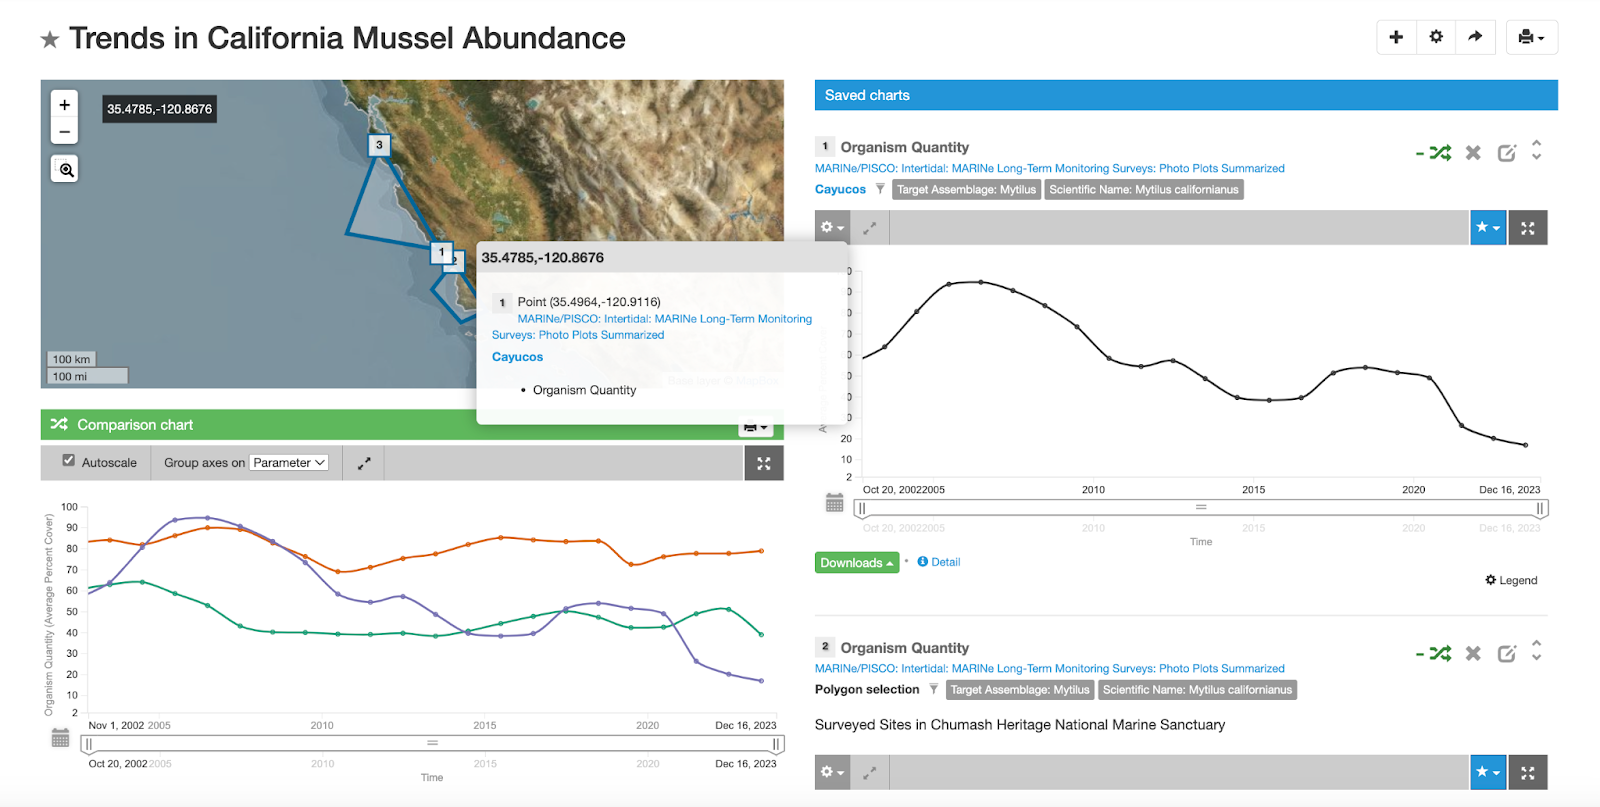
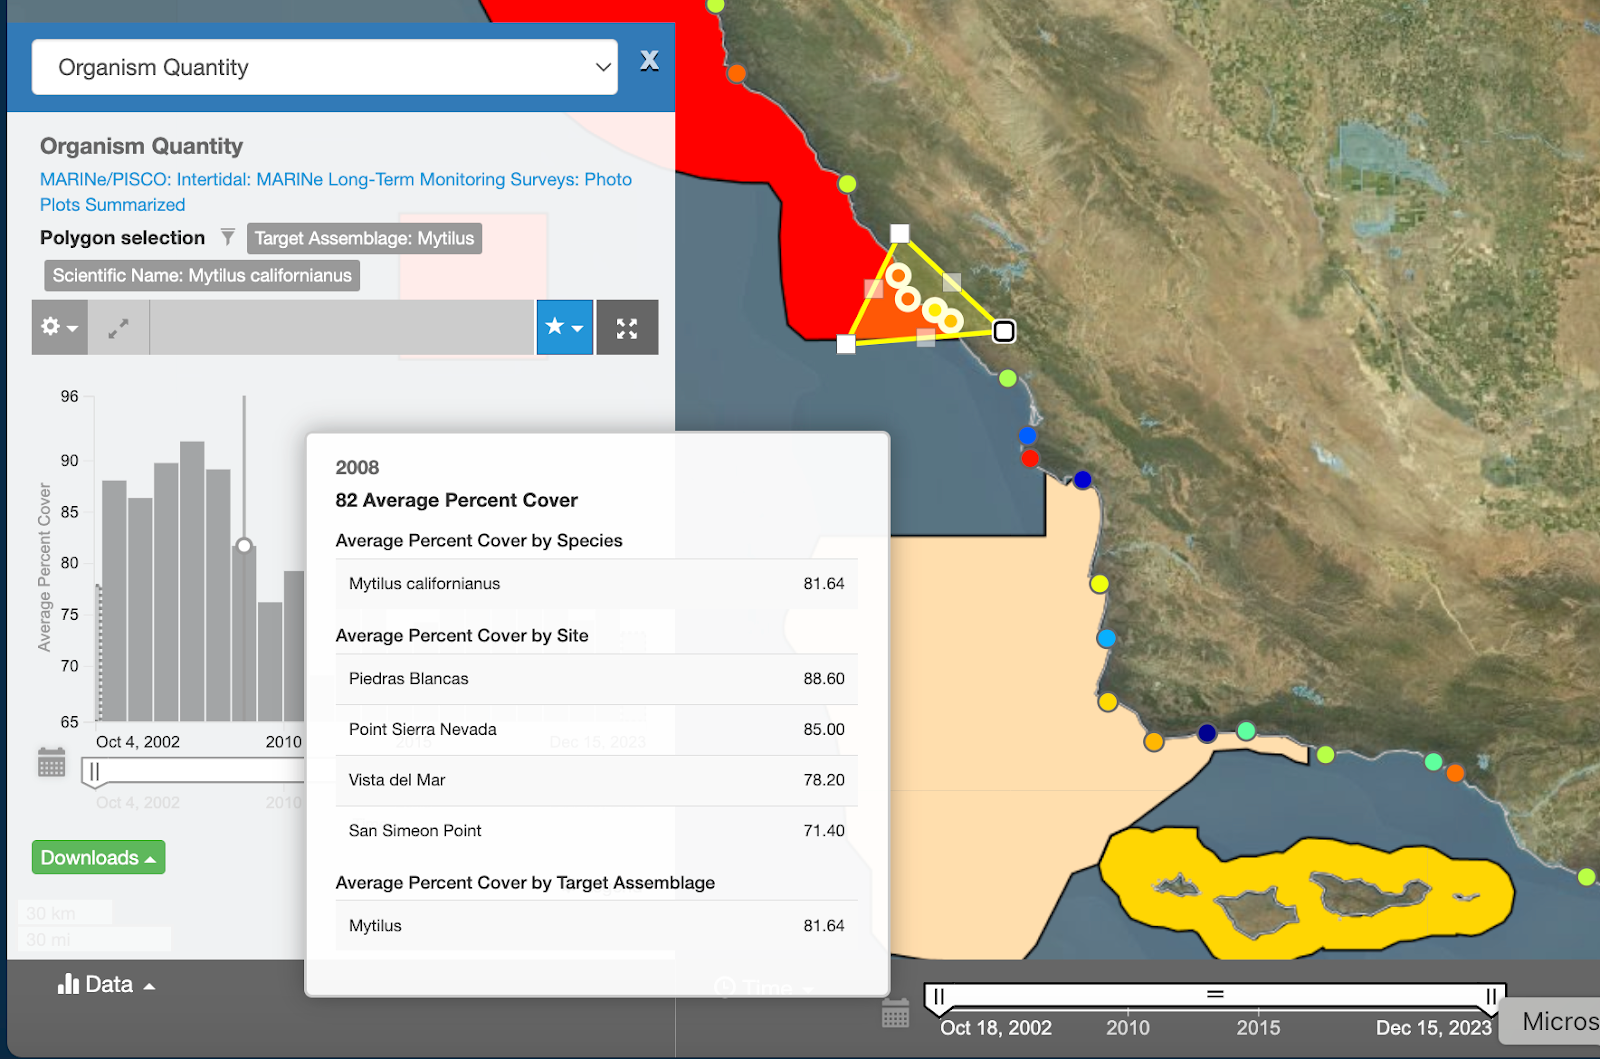
Utilizing the map polygon tool and data view to explore trends in California mussels inside and outside National Marine Sanctuaries in California.
July 31, 2022
This version implements updates to the version 2.13 and new user-requested features, including tabular data panel, print charts feature, in-map tag filter, and custom configured dashboards for quicker access to data themes.
introduction of print charts and data views as jpg image
tabular view panel for latest observations of real-time sensors
user-selected feature to show latitude and longitude grid on a map
introduction of in-map spatial, tag, and result type search filters
prototype of dashboards for custom configurations of spatially-enabled time series data layers (examples:Mariner Dashboard, CalHAB Map, Automated Shore Stations).
beta release of glider dashboard for comparing real-time glider observations to World Ocean Atlas climatology
backend integration of Avalanche system for ingestion and visualization of high-resolution data
bug fixes

Tabular view for latest observations of real-time sensor.
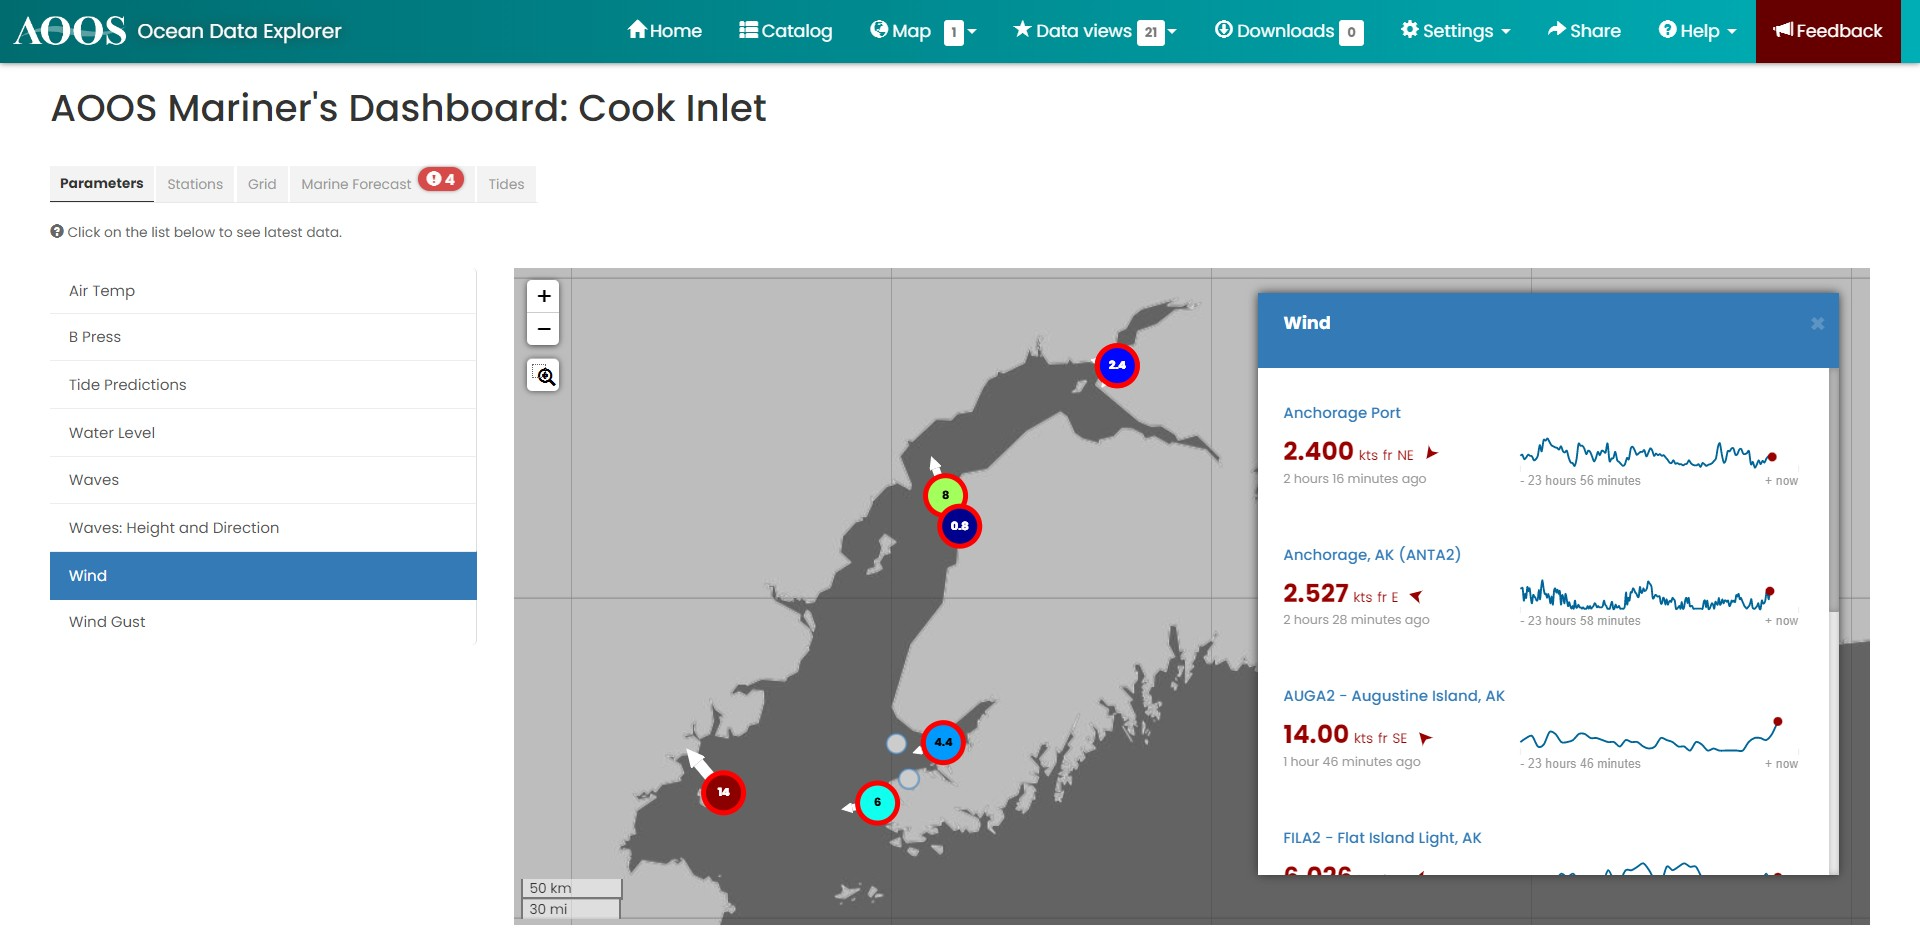
Mariner Dashboard with custom configurations of spatially-enabled time series data layers.
December 8, 2020
This release version features improvements to time slider performance, including brush selection for timeseries charts and introduces a user timezone selector. Enhancements were made to the data download UX to allow users to queue multiple datasets for download, add datasets to a download ‘shopping cart’, and share download compilations with other users. For applicable portals, custom draw and measuring tools are available in the main portal map. Additionally, users can add annotations to the map view and print the image to a pdf for integration in presentations and reports.
Display custom instrument narrative and annotations (where applicable) on in-situ station pages
User timezone selector in unit management
Dataset download interface improvements, including:
Ability to add queue multiple datasets for download
Download queue in toolbar
Share url for download compilations
Time slider-related improvements, including:
Brush time selection for timeseries charts
Time slider advancement buttons on the keyboard
Clear time bound selection
Code modularization
Bug fixes for fine time controls
Addition of search tags at the station level for advanced search and station filtering
Custom draw tools on the portal maps, including draw custom polygons, add shapes, measure distances, and create custom labels
Print custom map state to a pdf templates with annotations
Integration of prototype regridding service based on Django REST Framework to apply the stored configurations to produce regridded netCDF files for vector and model datasets
Performance enhancements for loading of animal movement data to enhance the track binning display to optimize loading and filter test or erroneous tracks

Brush selection for timeseries charts.
Timezone selector under Advanced Settings.
March 31, 2020
This version release addresses user-defined improvements, implementation of service error messages, and continuation of portal code migration to an open source platform. Prototype versions of platform tracks have been introduced for optimization in future releases.
Custom narratives available on station level pages
Continuation of portal code migration to open source platform for time slider and charting features
Introduction of service error messages
Remove dependency on user state service for load
Published documentation available for data providers to submit station log text files for display in applicable data portal(s)
Added thematic tags to individual data layers
Bug fixes relative to UTC time zone display in the browser
Prototype adding platform tracks (i.e. gliders) to a map
Additional portal user updates as identified by feedback to version 2.11a
November 1, 2019
This release resolves bug fixes and updates to key features that proceed the version 2.12 release.
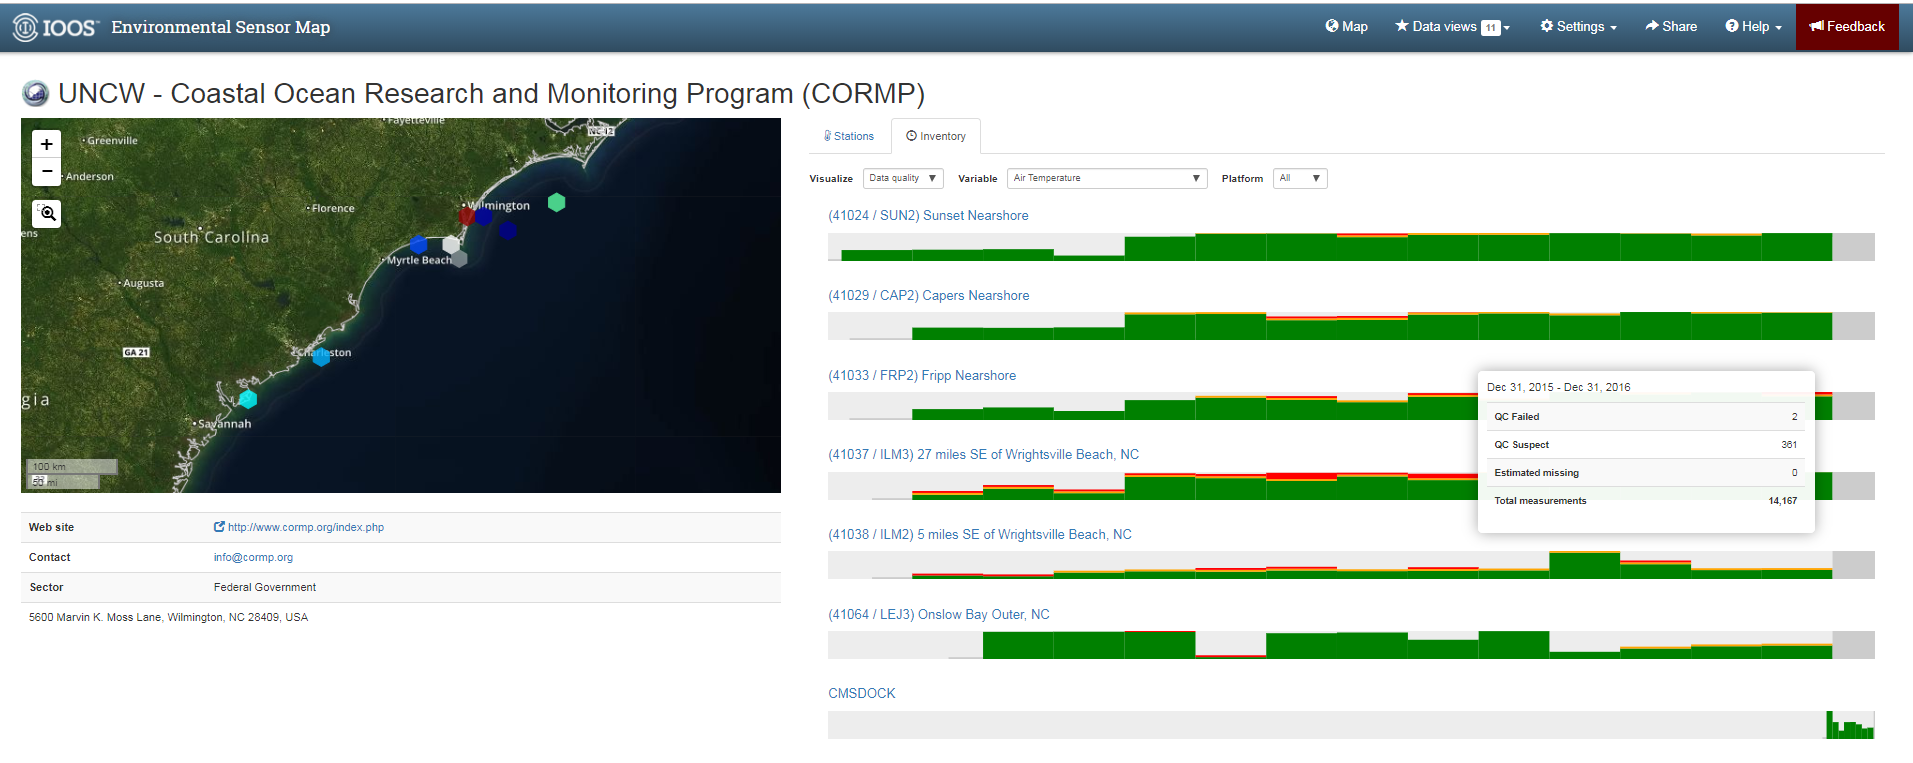
Expanded quality review inventory (i.e. summary) pages showing flag roll-up for data sources and stations and full display of quality review flags at the individual sensor level for IOOS RA funded assets
Demonstrate a few examples migrated elements of portal code to open source platform (charts, etc)
Integration of v2 platforms to the portal backend
Added custom unit display manager for users
Performance optimization and harden cache service for historical datasets using v2 service
Bug fixes
August 1, 2019
This release realizes full integration and enhancements of the v2 sensor system together with the calculation and display of QARTOD tests for observation data within the portal.
Improvements to quality review flags and user interface based on initial feedback
Quality review inventory (i.e. summary) pages showing flag roll-up for data sources and stations and full display of quality review flags at the individual sensor level for sensors containing data quality flags submitted by the data provider
Enhancements to mobile platform visualization
Aggregation of in situ platforms by source provider within catalog (available April 2019)
Update depth and climatology charts for new v2 sensor system and enable data views for v2 sensor interface*
Integration of catalog search tag for QARTOD datasets
For real time sensors, highlighting of selected parameter on the map to differentiate cells that contain the parameter and those that don’t when ‘Show all’ is selected
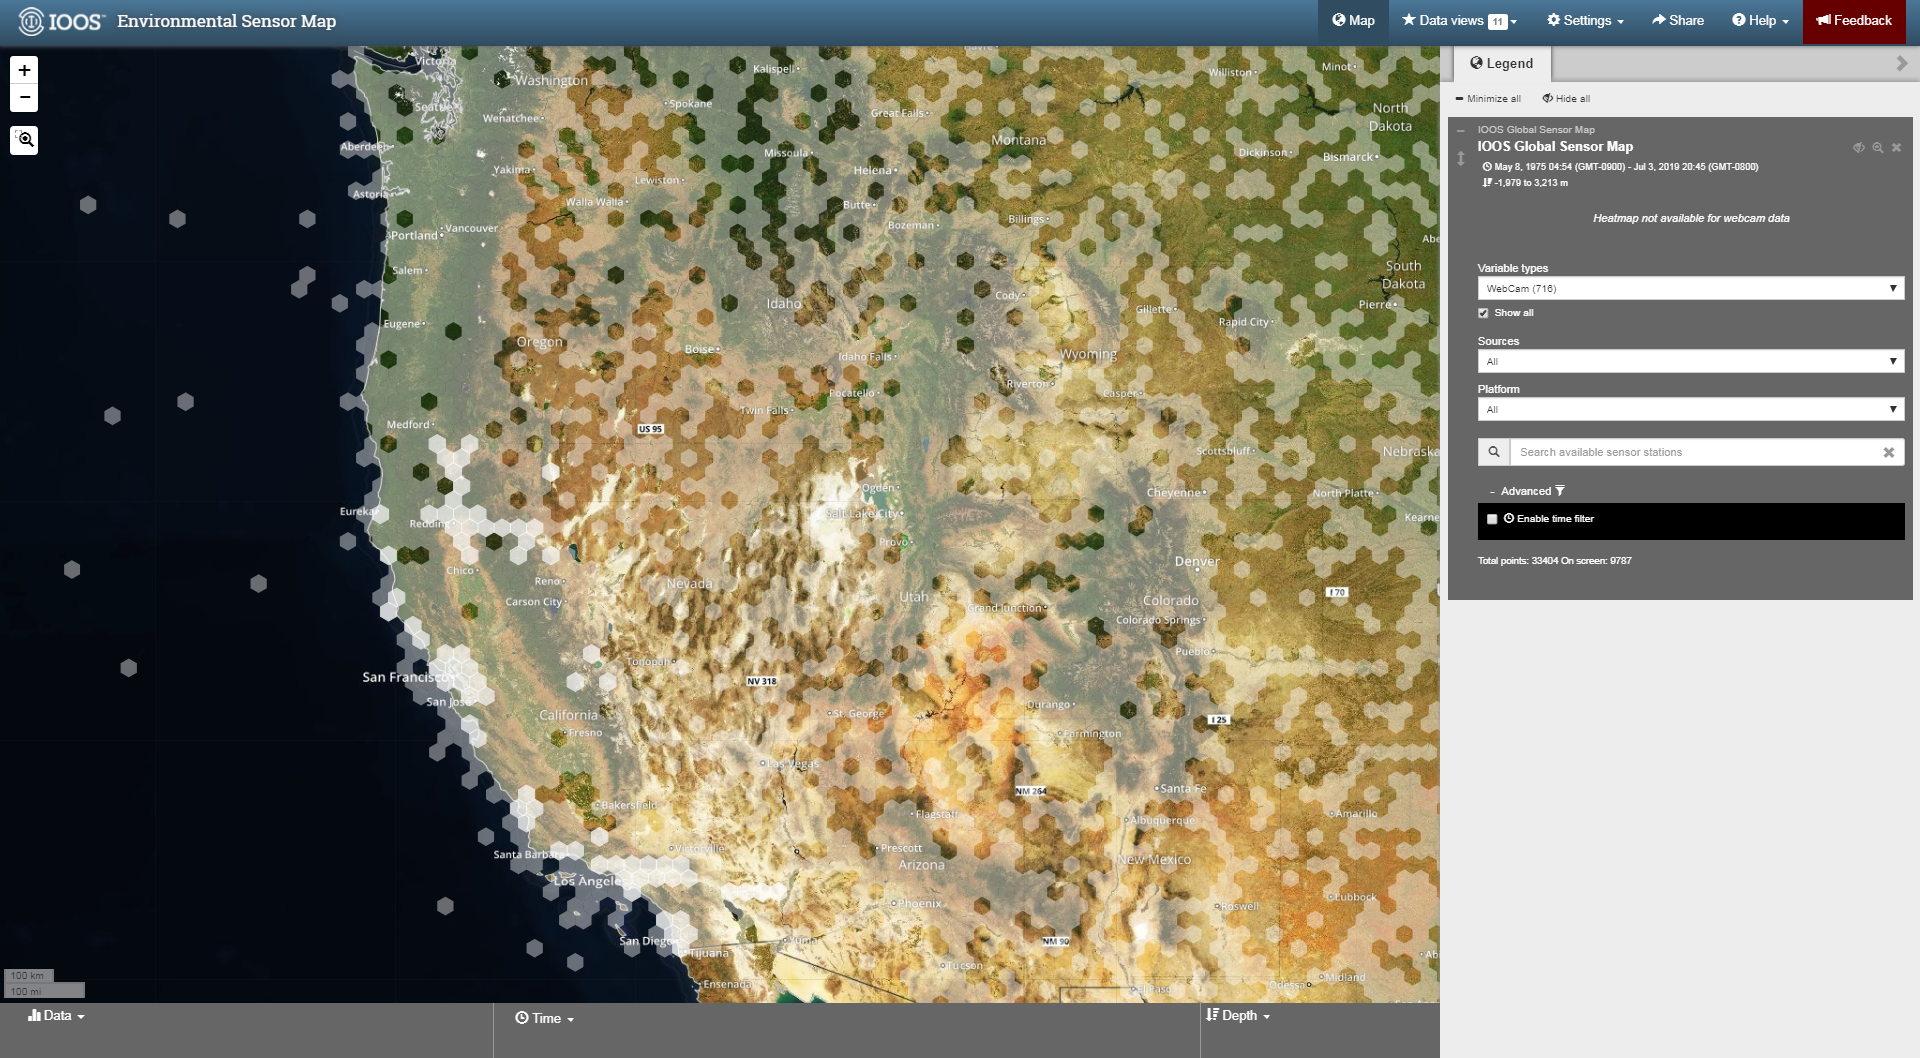
For real time sensors, default time slider to ‘off’ and added an advanced filter option for ‘Enable time filter’ in response to user feedback when exploring real-time conditions
Bug fixes
February 27, 2019
This 2.10 version introduces portal display of existing data quality flags from sources, layer opacity controls, and updates to the visualization and data handling for moving platforms.
Implementation of basic QARTOD test calculations for observation data and display of quality flags in portal
Updates to moving platform visualization and improved performance through data binning
Performance improvements to speed viewing of climatology and binned data charts
Ongoing improvements to user navigation and search interface for data catalog relative to feedback, and the inclusion of variable roll-up for search terms and layers groups
Reintroduction of opacity control for stacked data layers
Migration of custom or regional data portal visualizations to the v2 interface
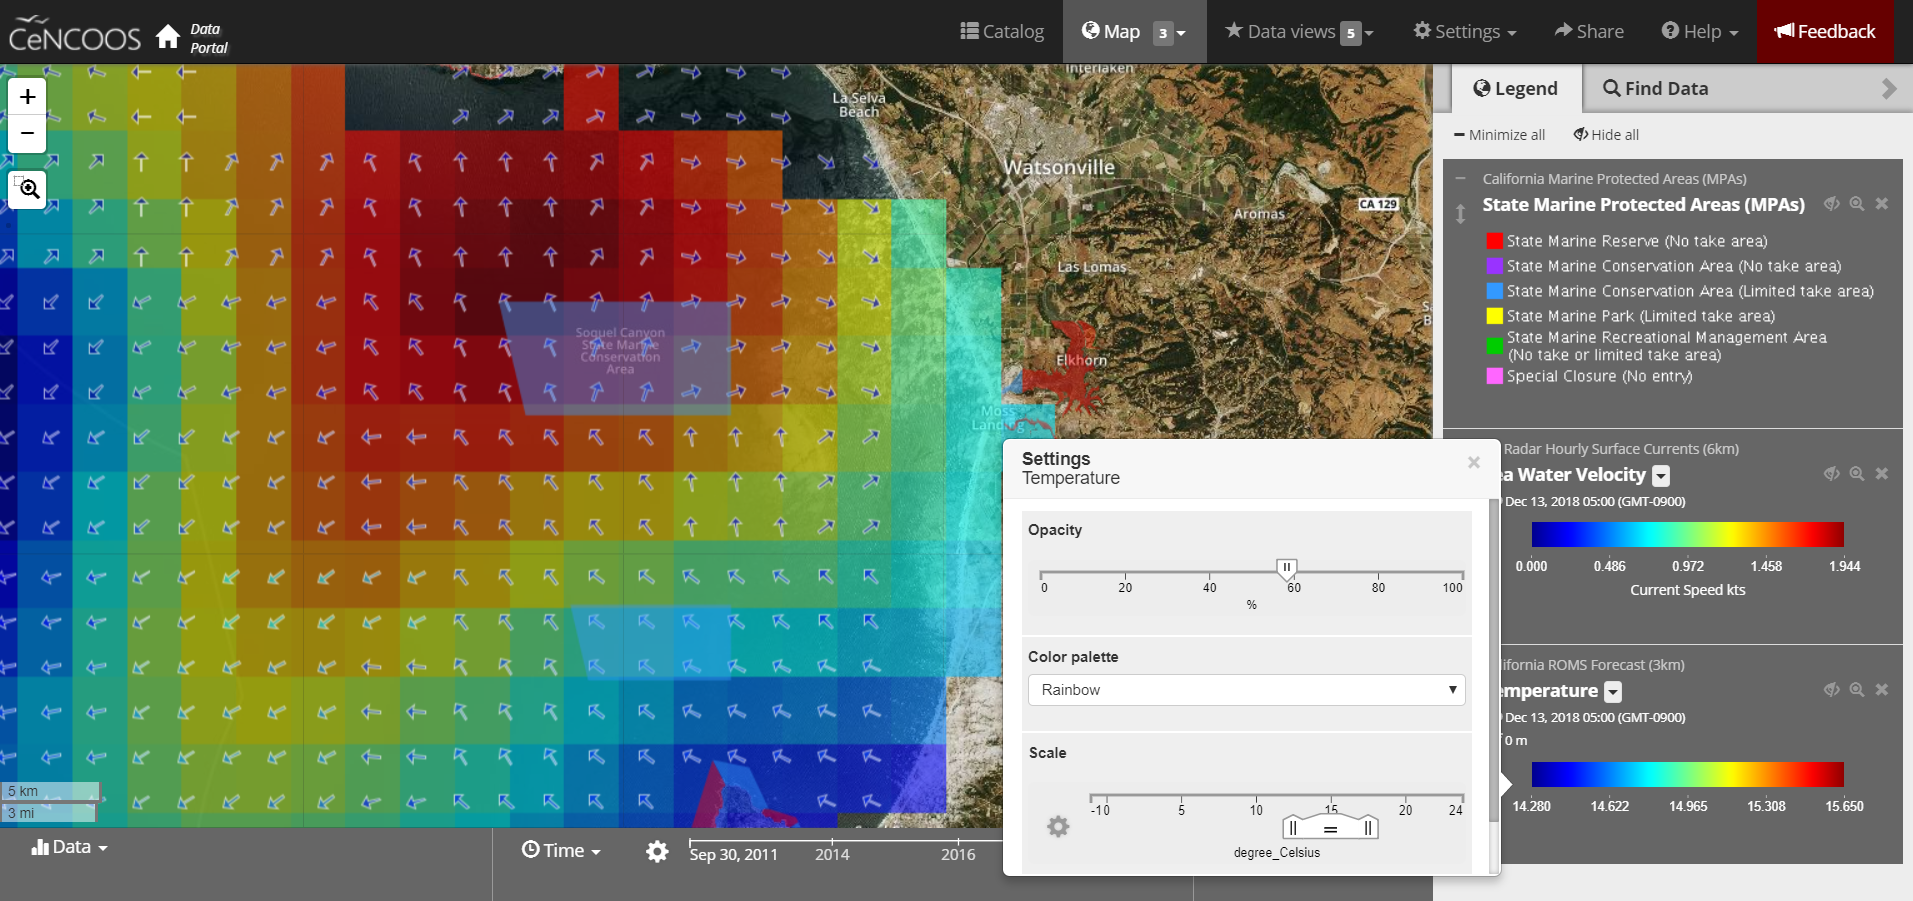
Layer opacity control for stacked data layers.
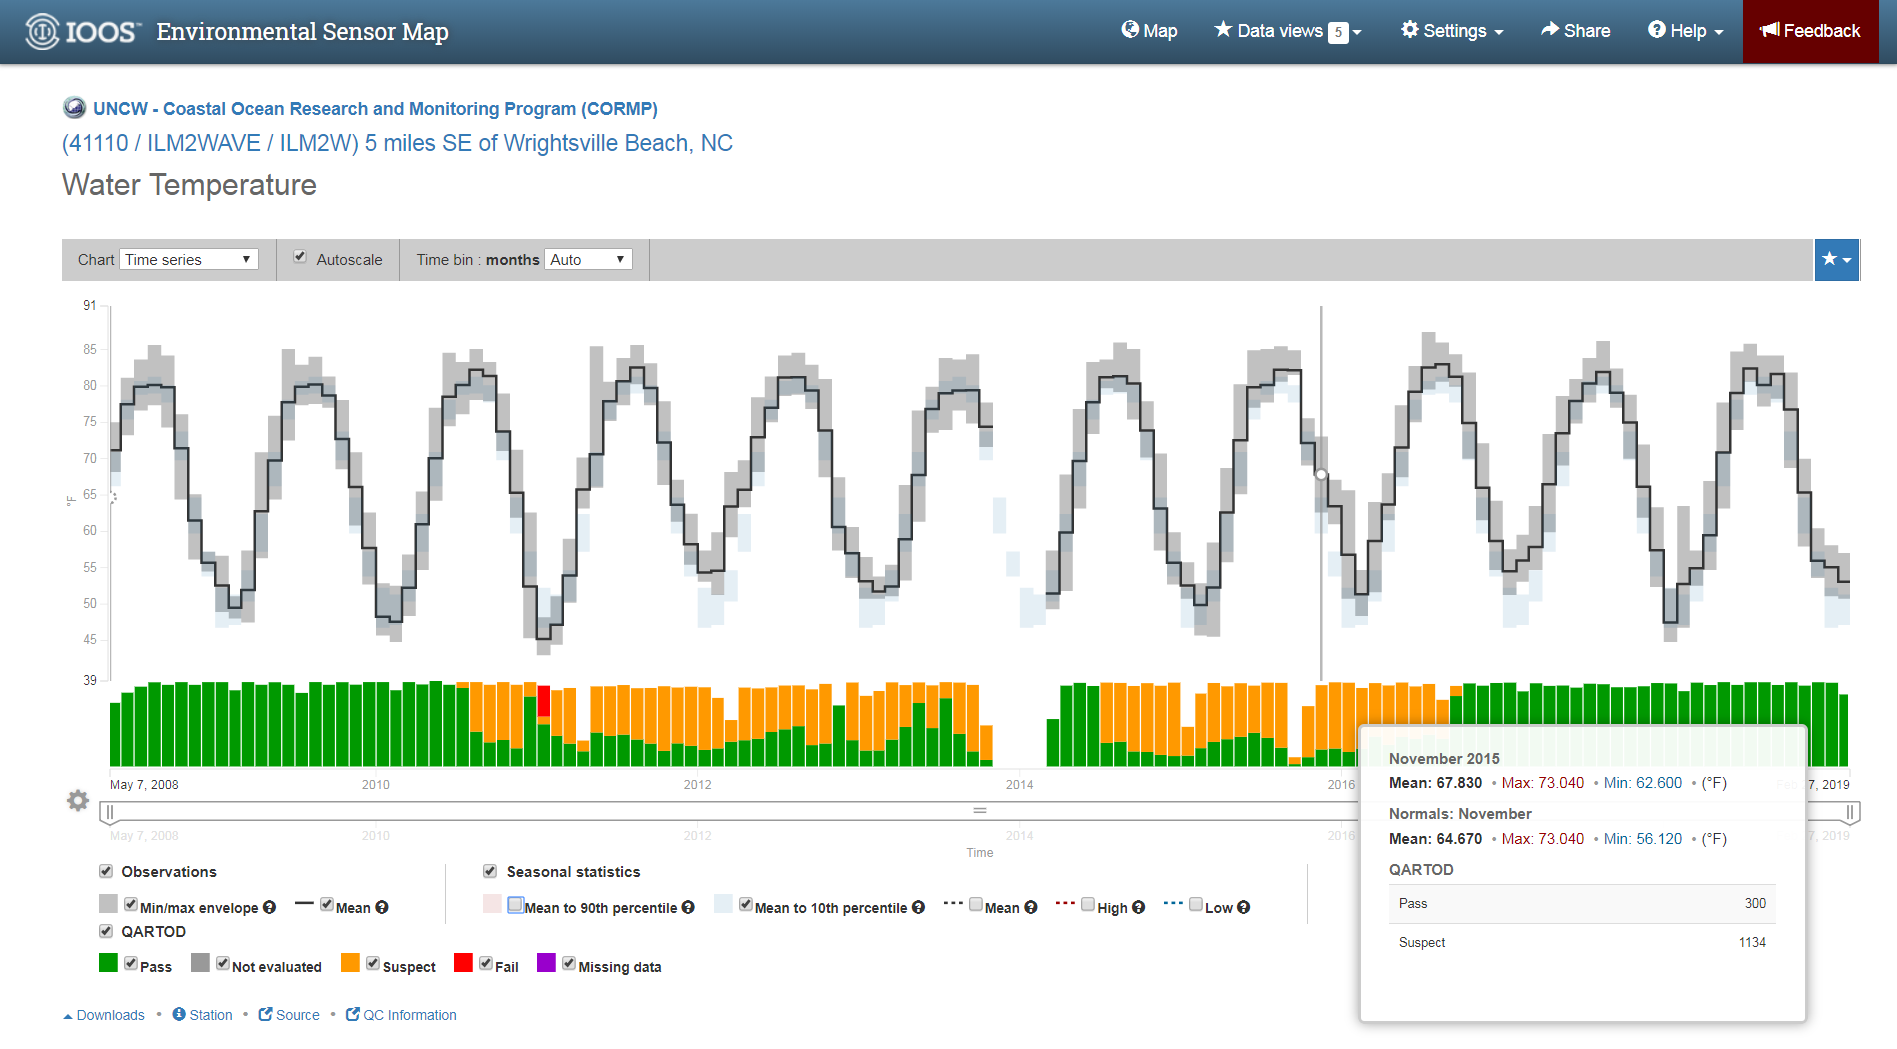
Data quality test display for flagged sensor data streams.
December 5, 2018
The 2.9 version replaces the beta 2.8 version with improvements to the existing search functionality and introduction of a new method for accessing help docs.
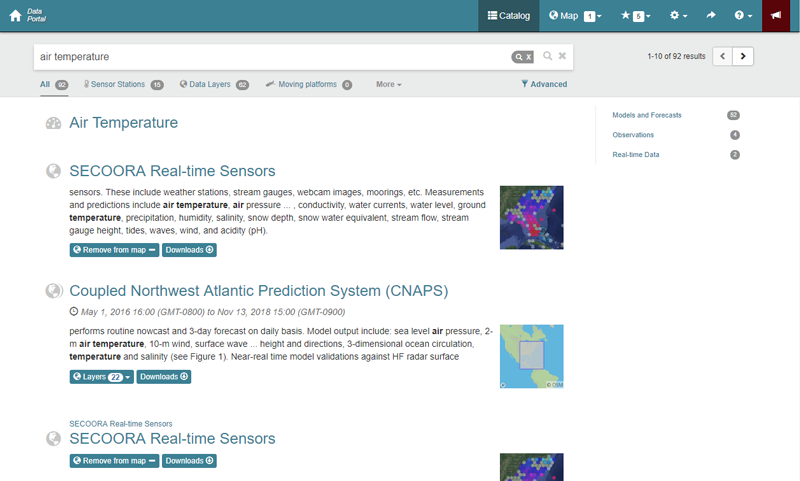
Improved catalog search with active filters for quick removal.
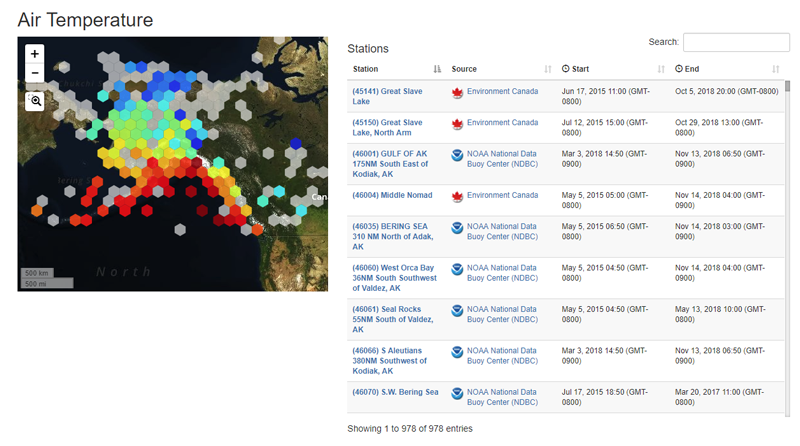
Variable type result page with links to station and source pages for closer data investigation and access.
In-map access to search to add layers directly from the map.
Interactive Help
April 2, 2018
The 2.7 version replaces the beta 2.6 version with an operational version of the new portal. Enhancements were made to partition real-time from historical data feeds to quicken load speeds. Additionally, real-time conditions are available on a mouse hoiver and persist to selected data views.
Real-time conditions and trend lines are available on feature hover.
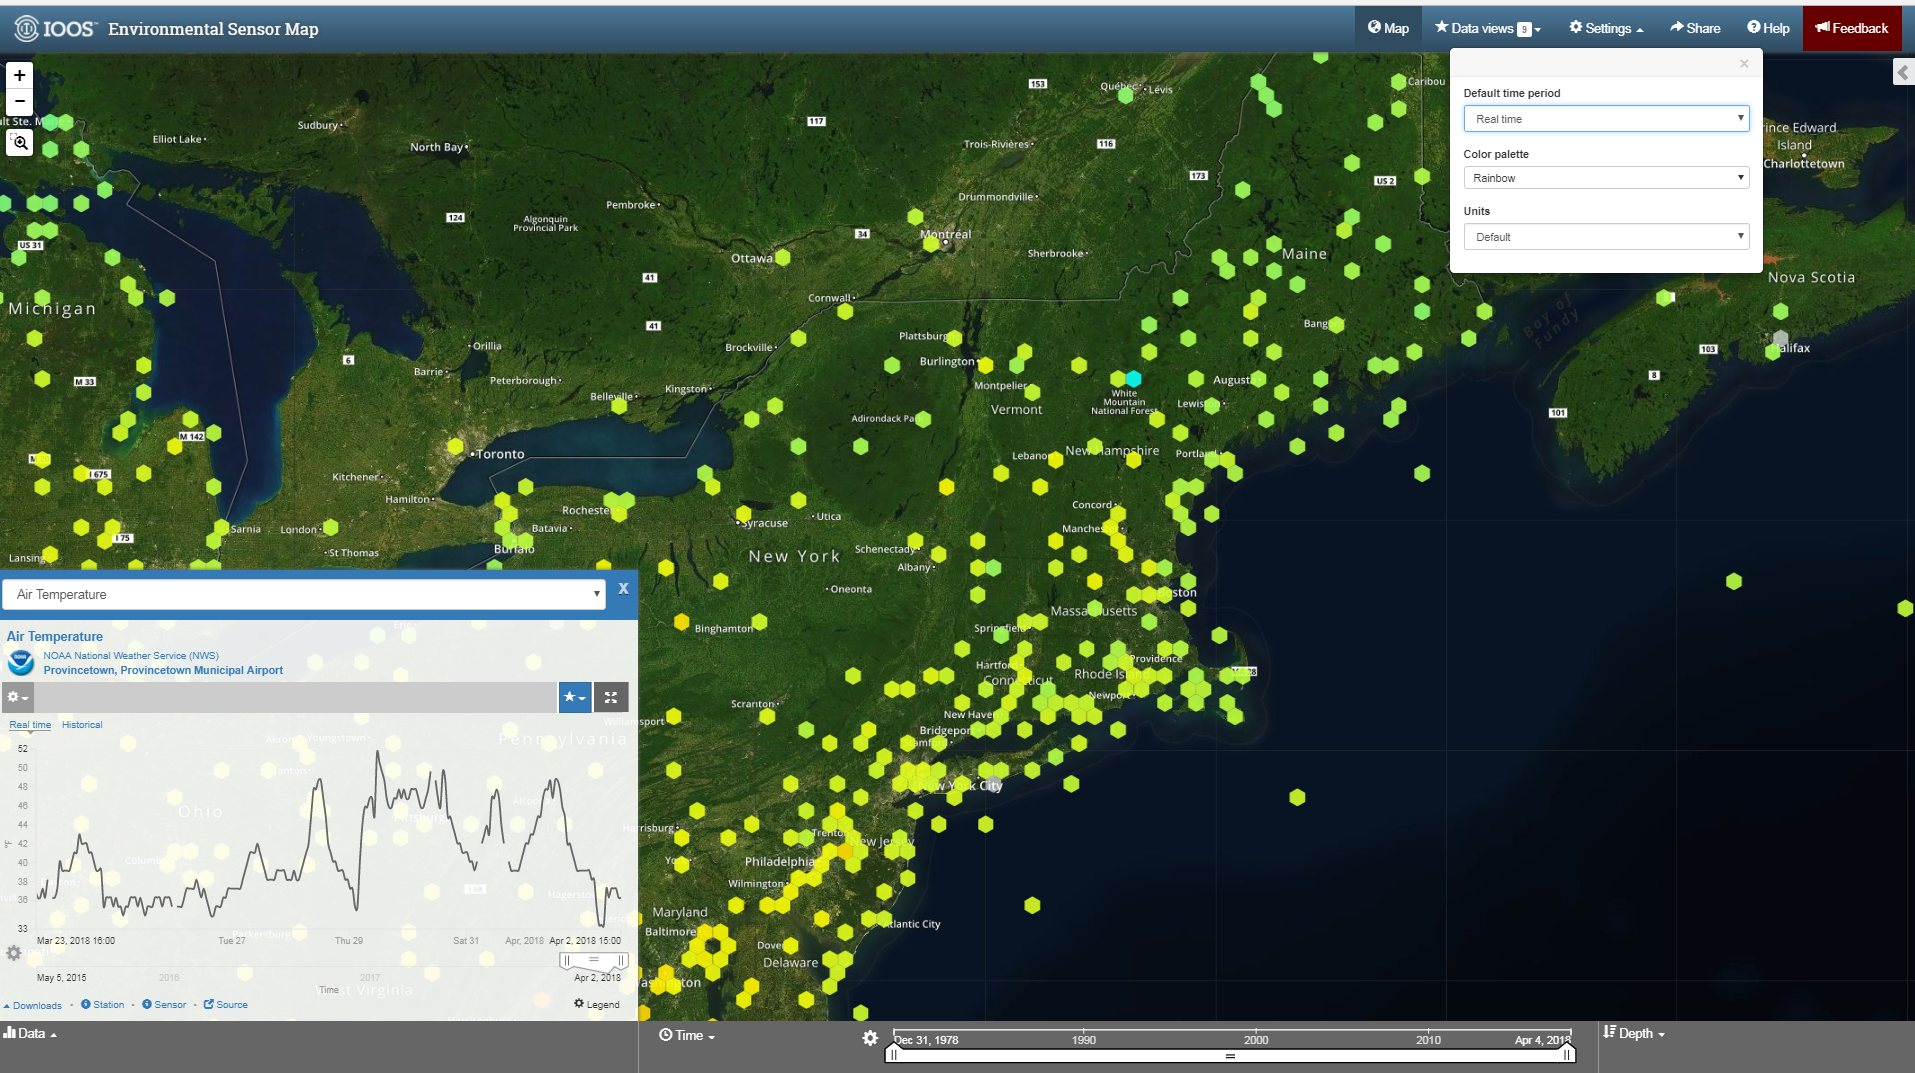
Sensor data are partitioned into real-time and historical time periods. Users can change the default time period view under map Settings. Or, by toggling between real-time and historical conditions within the chart view.
March 1, 2018
The opt-in 2.6 beta version optimizes the portal search engine and reworks the catalog and metadata views. The catalog now includes icon for quick, visual identification of data types (e.g. layers, sensors, and mobile platforms). Enhancements were made to more easily manage layers and download or add interactive data to a map.
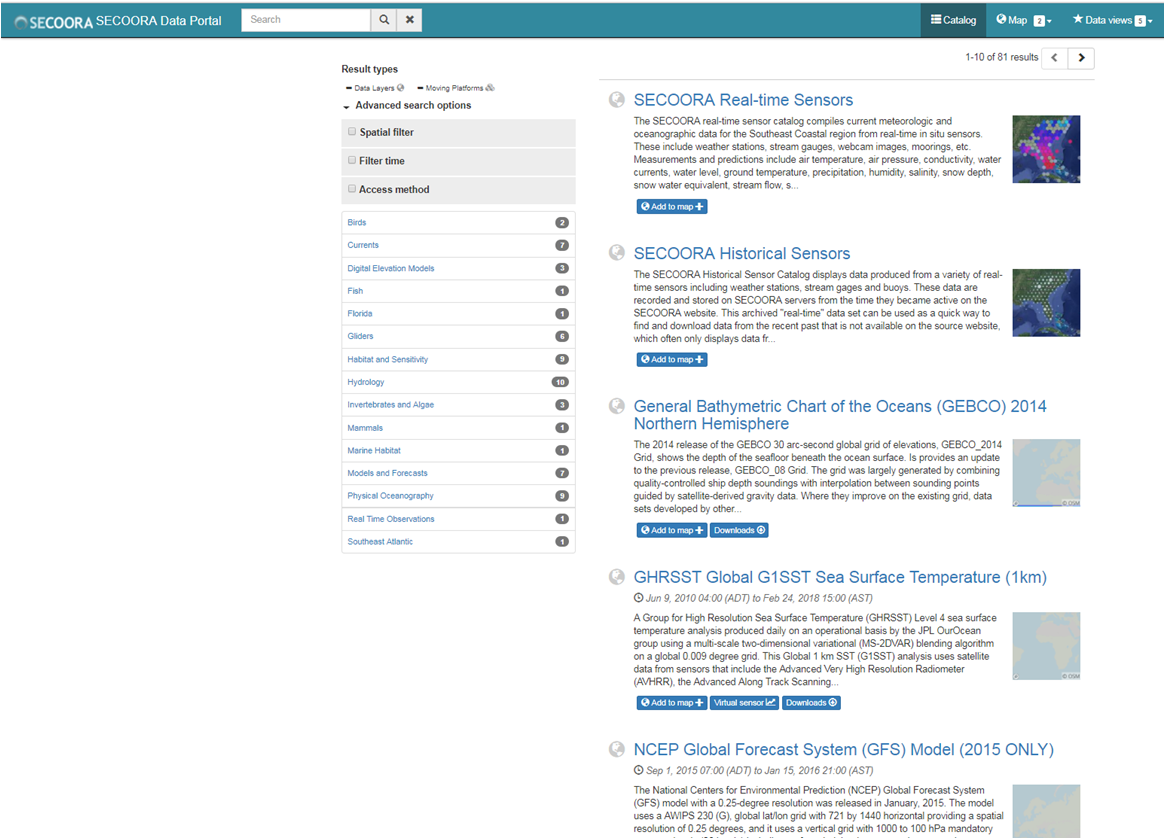
Icons were added to layers in the Data Catalog for easy identification among data types. The catalog views were reworked to ease the readability of data layers.
The number of layers within a Data Catalog module were summarized for quick reference. Users can quickly downloaded data using interoperability from with the Catalog and data layer views.
February 1, 2018
The opt-in 2.5 beta version release features the integration of biological vector data layers with physical and environmental data. Enhancements were made to Data Views to include the stations or spatial areas of interest in a map; individual stations or spatial areas were uniquely numbered for easier identification in data charts; and improved the ability for users to download data and add individual charts to a data comparison.
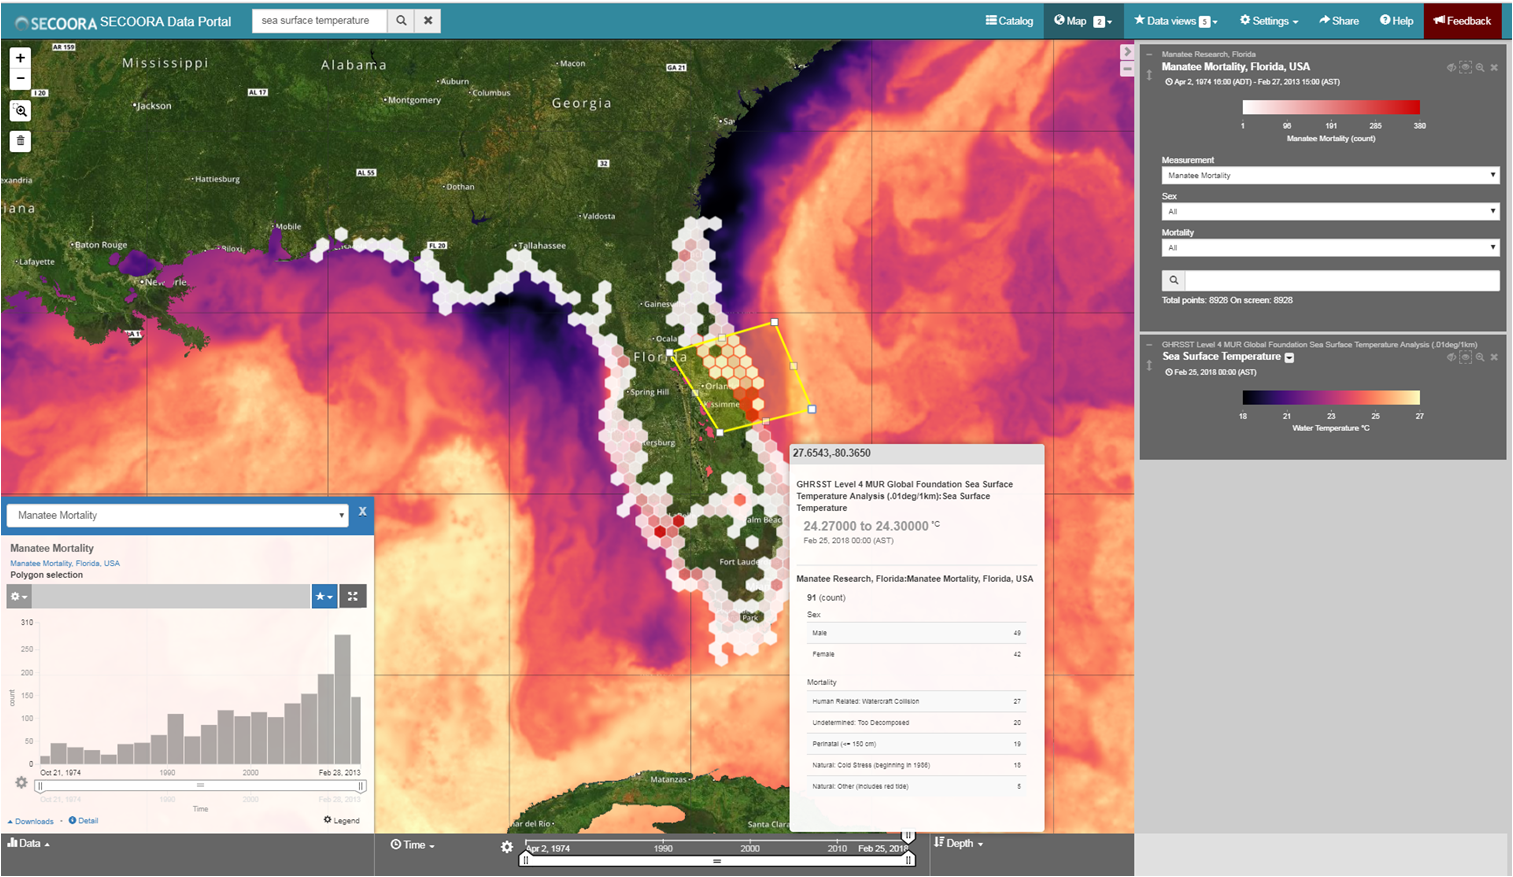
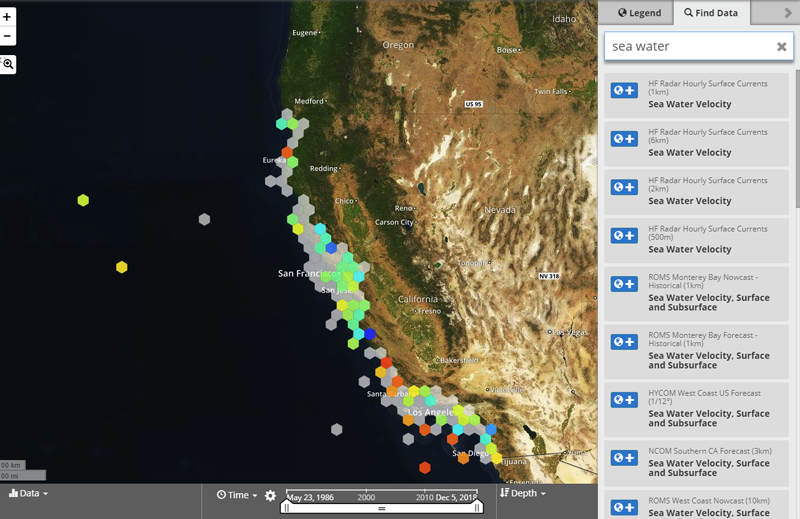
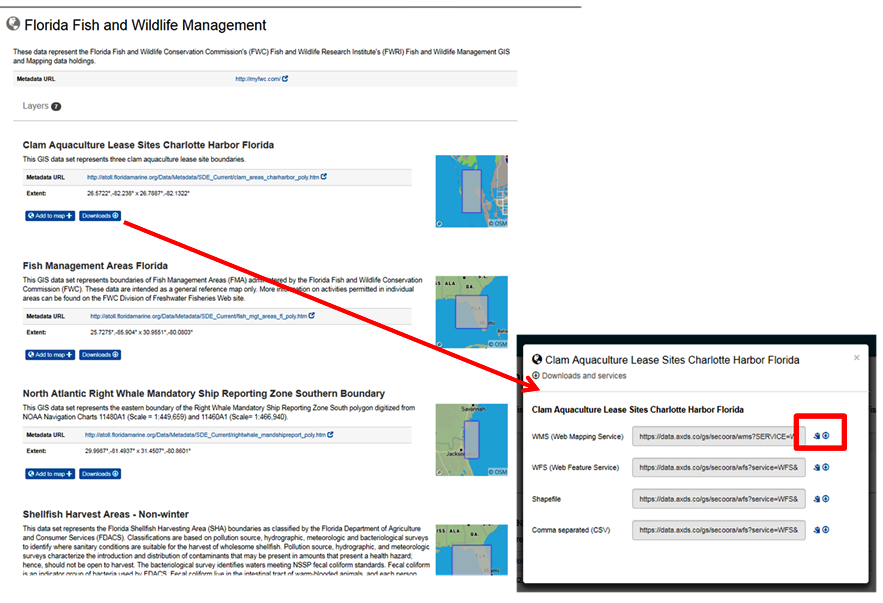
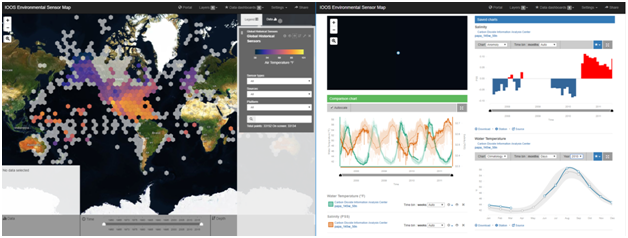
Vector data can be added to the Portal Map using hex bin heat mapping, and quiered spatially to visualized and download timeseries data summaries.
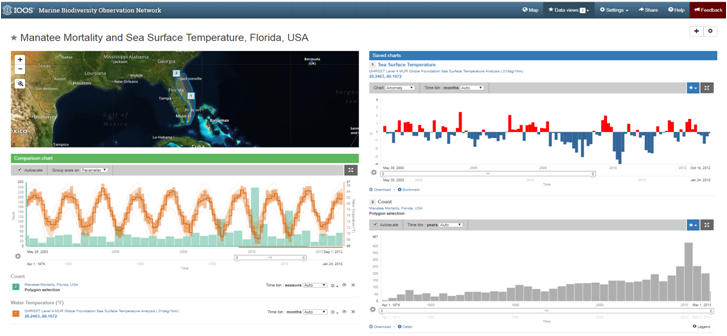
Biological data can be added to custom Data Views and compared with physical, environmental, or spatially-quiered model data (e.g. virtual sensor) for data comparison (right).
December 20, 2017
The opt-in 2.4 beta version includes 4D explorer and raster enhancements for glider, cruise, and model data. A data catalog is now accessible in the 2.4 version for discovery, browsing, and visualization through the portal map. Within the catalog, only real-time sensor, glider, and model data are available for visualization using the 2.3 and 2.4 version features. Visualization of the remaining data layers will be made in the version 2.5-2.7 releases. This release also includes user interface improvements and bug fixes.
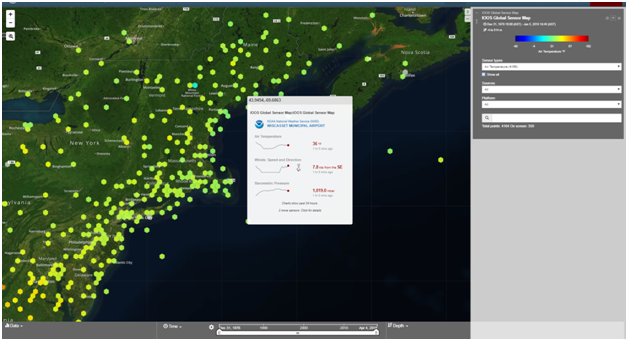
Real-time sensor data can be explored in the Data Catalog and added to the Portal Map for visualization (left). Real-time and virtual sensors for model layers can be added from the Portal Map to the Data Views for data comparison (right).
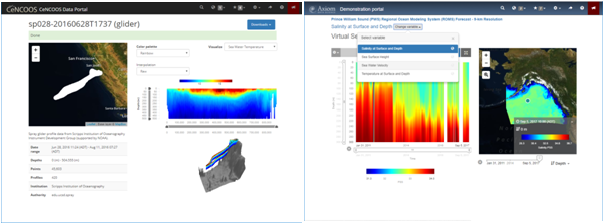
Individual pages for glider deployments, including 3D data charting and trajecotry parsing (left). Depth filtering of profiling sensor available with user-selected methods of interpolation (right).
October 1, 2017
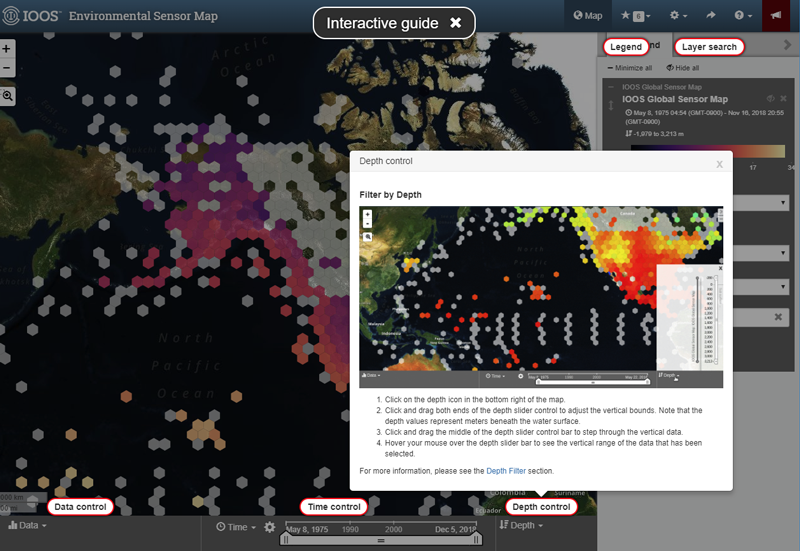
Opt-in beta version offered as link from existing map portal. Enhancements made to real-time data layers only. Future releases will migrated other data layers, such as model data, biological data, etc in future releases. New map interface includes splash page with introductory text and featured data dashboards (e.g. tool for visualizing highlighted data scenarios).
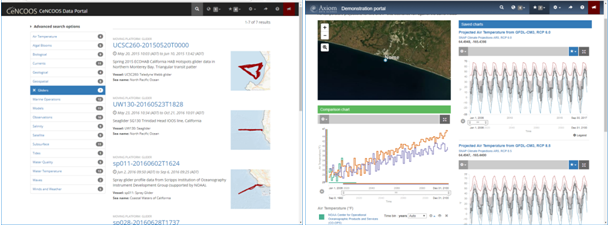
New map interface with palette control (left), and comparison charts between different sensors and parameters (right). Data charts offer user selection of climatology or anomaly views for longer timeseries (>3 years).
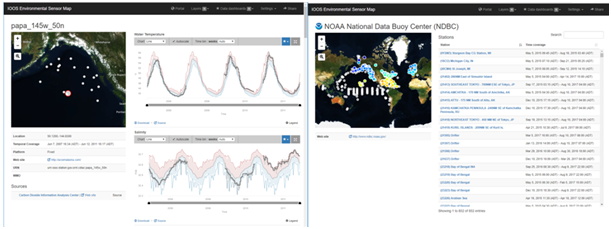
Station level pages both station data alongside metadata and source information (left). Data sources are discoverable with links to individual stations (right).